Analysing Smartwatch Data 本笔记本概述了如何使用 HeartPy 分析从智能手表设备获取的原始 PPG 数据。
与指尖或耳垂上的典型 PPG 传感器相比,以这种方式测量的信号包含更多的噪声,指尖或耳垂上的灌注比手腕上的灌注更容易测量。
分析此类信号需要一些额外的步骤,如本笔记中所述。
首先让我们加载依赖项和数据文件:
1
2
3
4
5
6
7
8
import numpy as npimport heartpy as hpimport pandas as pdimport matplotlib.pyplot as plt'raw_ppg.csv' )
1 Index(['ppg' , 'timer' ], dtype='object' )
查看文件格式。
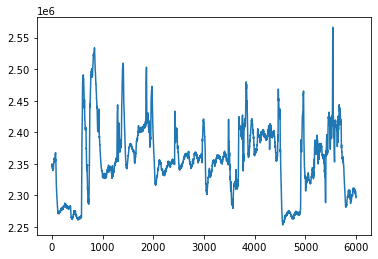
1 2 3 4 plt.figure(figsize=(12 ,6 ))'ppg' ].values)
PPG 似乎有断断续续的部分点缀在非信号之间(传感器未记录的时间段)。
现在,让我们对第一个信号部分进行切片,看看发生了什么。稍后我将向您展示如何自动排除非信号部分。
1
2
3
4
signal = df['ppg' ].values[14500 :20500 ]'timer' ].values[14500 :20500 ]
现在我们需要知道采样率。它用于计算所有其他内容。
HeartPy 有多种从计时器列获取采样率的方法。让我们看看计时器的格式:
1 2 3 4 5 6 array([ '11 : 10 : 57.978 ', '11 : 10 : 58.078 ', '11 : 10 : 58.178 ', '11 : 10 : 58.279 ', 11 : 10 : 58.379 ', '11 : 10 : 58.479 ', '11 : 10 : 58.579 ', '11 : 10 : 58.679 ', 11 : 10 : 58.779 ', '11 : 10 : 58.879 ', '11 : 10 : 58.980 ', '11 : 10 : 59.092 ', 11 : 10 : 59.180 ', '11 : 10 : 59.283 ', '11 : 10 : 59.381 ', '11 : 10 : 59.481 ', 11 : 10 : 59.582 ', '11 : 10 : 59.681 ', '11 : 10 : 59.781 ', '11 : 10 : 59.882 '] ,
格式是 HH:MM:SS:mm
HeartPy 附带了一个日期时间函数,可以使用 get_samplerate_datetime 将日期转化为采样率。
1 2 3 4 5 '%H:%M:%S.%f' )print ('sampling rate is: %.3f Hz' %sample_rate)
1 sampling rate is: 9.986 Hz
采样率相当低,但为了节省电量,许多智能手表都采用这种方式。对于确定 BPM 来说这很好,但任何心率变异性 (HRV) 测量都可能不会非常准确。
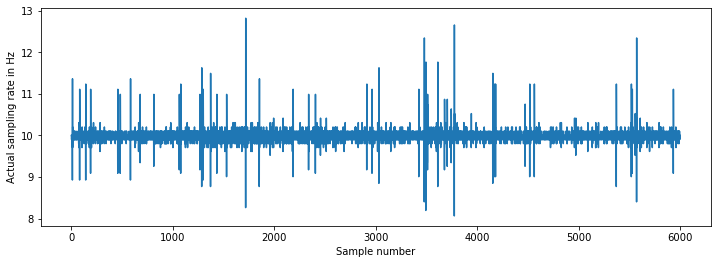
采样率的第二个考虑因素是它是否稳定。包括智能手表在内的许多设备可以同时执行许多操作。他们运行的操作系统除了测量心率外还有其他任务,因此当以 10Hz 进行测量时,操作系统可能不会每 100 毫秒就准备好进行一次测量。因此,采样率可能会有所不同。
1
2
3
4
5
6
7
8
9
10
11
12
13
14
15
16
17
18
19
20
from datetime import datetime'%H:%M:%S.%f' ) for x in timer]for i in range (len (newtimer) - 1 ):1 / ((newtimer[i+1 ] - newtimer[i]).microseconds / 1000000 ))12 ,4 ))'Sample number' )'Actual sampling rate in Hz' )print ('mean sampling rate: %.3f' %np.mean(elapsed))print ('median sampling rate: %.3f' %np.median(elapsed))print ('standard deviation: %.3f' %np.std(elapsed))
1
2
3
mean sampling rate: 9.987 : 10.000 : 0.183
信号均值接近 10Hz,并且方差较低。 偶尔出现 12Hz 的峰值或 9Hz 的下降表明计时器不准确,但这种情况并不常见。
对于我们当前的目的来说,这已经足够了。
当然,您可以对信号进行插值和重新采样,使其具有精确的采样率,但对计算测量的影响可能很小。


